Wall Street and investors do the earnings report season dance every four quarters. But how do we read earnings reports, and what can they tell us?
Many investors spend much time reading through earnings reports to glean information. Every company that trades on the stock market must report earnings and investors comb through these reports looking for interesting nuggets.
Warren Buffett is one of the leading investors who ignores earnings reports. He stresses long-term investing and feels earnings reports focus on the short-term. He believes these reports come at the expense of focusing on the company’s long-term health.
Unlike his peers, Buffett doesn’t have a quarterly earnings call and only releases the required filings.
I admire Buffett, but we can learn quite a bit from earnings reports and they can help us stay on top of management and get a feel for their direction.
In today’s post, we will learn:
- What is an Earnings Report?
- Components of the Earnings Report
- Where Can We Find Earnings Reports?
- What To Look For In Earnings Reports
- Example of Earnings Reports
Okay, let’s dive in and learn more about how to read an earnings report.
What is an Earnings Report?
When we invest in the stock market, we buy or sell parts of businesses. These businesses trade on the public stock markets.

Each public company has a set of financial requirements they must meet, including filing annual and quarterly financial statements with our friends at the SEC. The SEC, or Securities and Exchange Commission, ensures each company meets these requirements.
The annual (10-K) or quarterly (10-Q) filings give us the latest financial information for Visa, for example.
The quarterly earnings report focuses on Visa’s performance over the latest quarter. It tells investors how the company has done over the last three months and can give us insight into Visa’s financial health and any developments during the quarter.
Metrics like revenue, earnings per share, and guidance are words you will hear a lot.
We will discuss those a bit later, but our goal is to look longer term.
Many in the markets will focus on the short term and place a huge emphasis on quarterly results. You will see wild share price swings depending on the market’s view of results. The earnings results can tell us how Visa continues to perform financially.
But contrary to popular belief, a company’s long-term performance doesn’t rely on earnings.
Instead, it relies on long-term free cash flow generation and reinvestment. But that is another story for another day.
We can learn a lot about a company from the earnings reports. Beyond the financial knowledge, we can also hear how management thinks and decipher what they believe might be challenges or tailwinds for the company.
Components of the Earnings Report
Each quarter, every public company must file its earnings reports. How each company divides its quarters will depend on its annual cycle. But regardless of the cycle, they will all have four quarters.

It can be confusing; for example, Microsoft reports its fiscal year runs from July 1 to June 30.
This means they report first-quarter earnings when most companies report third or fourth quarter. Don’t let the different quarter terminology hang you up. Instead, focus on extracting the right information from each report.
The three filings companies can file include:
- 10-Q or quarterly (required)
- Press release
- Presentation/Earnings Call
10-Q
Every quarter when each company files earnings, they have to file a form 10-Q. Form 10-Q reveals all the required financial data, like revenues or earnings. The 10-Q is the most generic of the reports and contains all the hype-free financial data.
In the 10-Q, investors will find the income statement, balance sheet, and cash flow statement. The company will also include any market risks the company might face. We will also find commentary from management on the performance during the quarter.
One of the perks of the 10-Q is no marketing bias or hype; they remain straightforward and to the point.
One of the downsides: they don’t have to audit these reports, meaning the numbers may not be “accurate.” Each company, by law, must report real numbers, but they can adjust them to fit their goals.
For example, you will find adjusted earnings or adjusted EBITDA throughout these reports. As they are not GAAP-approved measures, they can be misleading, so we must remain alert. The annual report reconciles all the numbers, which is a fancy word for making sure everything adds up correctly.
Press Release
The press release helps make the 10-Q information easier to read for investors. Companies will transform their 10-Q into a press release highlighting the positive parts of the report.
Some of the more common information released in the press release include:
- Revenues
- Net income
- Earnings per share
- Dividends
- Share repurchases
You will also find limited management discussion on the company’s overall health.
The primary function of the press release is to highlight the company’s positive aspects. It can act as a rah-rah report for how great Amazon performed. But we need to look deeper, so we don’t buy the hype.
Many investors will only look at the press release and invest based on these results. Please don’t do this.
Almost no company will list things going poorly in their press release. We must remember these results go out to the financial press, amplifying the results.
Press releases can offer us great snippets of a company’s performance and then we can dive deeper later.
Presentations/Earnings Calls
The presentation deck outlines the more positive aspects of Visa’s quarter. Companies create decks for retail or professional investors to provide visual highlights of the quarter. They design them to focus on the highlights and show the company positively.
The earnings calls have two parts: the management presentation and analyst questions.

The management presentations tend to be long and prepared ahead of time, with the CEO or CFO reading them to investors. But the analyst questions aren’t scripted and can give us insight into management decision-making. Plus, you can see how they treat normal human beings. Some can be rude and snotty, but others are polite and genuine.
These little tidbits can give you insight into the culture. If they treat an analyst poorly, what will stop them from treating employees badly?
The earnings calls are a bit of a dance. The analysts need access to management to create their reports and inside access, which means they must remain polite and cordial with management and not ask tough questions which could show the management or company in a bad light.
And management needs analysts to promote their company and say nice things to project a positive image. The dance helps create a positive aura around a company, which can drive market sentiment.
Combining the three parts of the earnings reports can give us great insight into Visa.
We must remember to take some information with a grain of salt. They will only present the positive side of things, and sometimes we must dig deeper to get the whole story.
Where Can We Find Earnings Reports?
For the most complete and up to date information on a company, we can start with the following:
The government website houses all required financial documents, including the 10-Q.
Along those lines, we can use our favorite financial websites, such as:
These websites contain links to the 10-Q reports and transcripts of the earnings calls.
To find earnings calendars to help you track your favorite companies, we can use the following:
These sites can help us track the upcoming earnings calendars to plan which companies to follow.
One hidden trick is following your favorite companies through their investor relations websites. For example, you can sign up for alerts via email or SMS (text).
I signed up for alerts from Visa, meaning I get an email from Visa whenever they announce:
- Earnings call
- 10-Q
- 10-K
- 8-K
- Form 4
Those are a few examples, but it is a great way to stay up to date on any company you follow. Companies sometimes spend a lot of money on their investor relations. They use those sites to promote their company, but also to help investors learn information.
You will find any financial documents filed with the SEC and any presentations the company has given there. For example, Visa spends some time going through presentations to help educate and promote the company. These presentations can provide additional insights into the company.
The 8-K is a tremendous source of information. Companies use this filing to report any important changes to the company. For example, they will use an 8-K to inform us about a merger or acquisition. Or they might include a notice about a press release related to earnings.
My last go-to for information on earnings reports is the Quartr app. The free app allows us to listen to/read any earnings call we desire. They started about a year ago and have become my go-to for earnings.
With the app, we can listen to any earnings call and read along with the transcript. They also create great visuals around each company and additional information. They have an earnings calendar and allow notifications, so you know when a company has reported.
What To Look For In Earnings Reports
We must understand the business model when going through a company’s earnings report. For example, a bank’s earnings will be different from Apple’s. We should focus on the numbers and metrics important to each company. But as a general rule, we have a few metrics we can look to for consistency:
- Revenue
- Earnings (net income)
- Earnings per share
- Analyst estimates
- Guidance
- YoY comparisons

Let’s unpack these a little.
Revenue
Revenue, or top-line, equals the total amount a company generated during the quarter. Revenue helps give us the broadest sign of how a company performed during the quarter. Revenue can also give us insight into cash flowing into the business and remains a great benchmark.
Each business model will have a different measure of revenue, so it’s important to understand how a bank generates revenue compared to how Microsoft does.
Earnings (net income)
Earnings, net income, or bottom line indicate how profitable the company performed during the quarter.
Wall Street LOVES earnings, and the wild market swings you see relate to earnings.
Earnings or net income also act as the starting point for free cash flow, which is the MOST important metric in investing. Wall Street focuses on earnings because they represent the accounting profitability and they can have a direct impact on the price of a company.
Earnings Per Share
Earnings per share equals net income divided by the shares outstanding. This one metric is easy to use and relatable for most investors, and most analysts use it to compare companies.
Instead of using earnings to compare Microsoft to Apple, analysts use earnings per share. For example, Microsoft reported $2.4 EPS in the latest quarter versus Apple’s $1.3.
They could infer Microsoft outperformed Apple during the quarter because of the higher EPS.
Analyst Estimates
What do investors use as a benchmark to compare revenues, earnings, and EPS?
The answer is analyst estimates.
Analyst estimates, sometimes referred to as “Wall Street estimates,” are one of the most popular metrics used to evaluate a company’s quarterly report. As quarterly reports start to surface, you’ll hear analysts claim that a company has either “missed” or are “above” expectations for earnings or revenue. This indicates that the report either failed to live up to (missed) or beat the broad investment community expectations.
Analysts create these predictions and follow the market or business.
Analysts will examine the following:
- Cash flows
- Forecasts
- Management guidance reports
- General market sentiment
All the above information must be before the publication of earnings reports. They attempt to create an estimate or reasonable target for the company to meet in their report.
Institutions, like Thomson Reuters, then compile these estimations into a consensus estimate. This provides an estimated benchmark average for an organization’s earnings report.
These analyst forecasts are noteworthy because they can cause a big change in the share price, either up or down.
Guidance/YoY Comparisons
Most companies will issue guidance based on what they expect to produce during the quarter. Many investors will compare these results to actuals. But a common trend is for companies to under-promise and over-deliver. So we should take these company estimates with a grain of salt.
You could argue no one knows the company better, but we must remember it’s all part of the game.
YoY or year-over-year comparisons are common metrics in earnings reports. These numbers can tell how much a company has grown or fallen over the past year. We will also see references to quarter-over-quarter and sequential. Sequential will refer to the prior quarter. For example, the company grew 5% from Q2 to Q3.
The information can be useful if the company operates in a cyclical type of business or sees impacts based on the seasons. For example, Walmart and Amazon see a spike during the holiday seasons, and comparing Q4 to the prior year can help.
Example of Earnings Reports
Let’s walk through an earnings report to get a taste of what to look for and what information we can find.
For our guinea pig, I will use Apple (AAPL), which reported 4th quarter earnings on October 27, 2022.
The first place I will visit is the investor relations page to find the 10-Q and press release. Below is a screenshot of the press release so you can see how they set it up.

Notice how they outline quarterly revenues, annual revenues, and earnings per share in actual numbers, along with year-over-year comparisons.
They also include commentary from CEO Tim Cook on higher-level ideas, while the commentary from CFO Luca Maestri focuses on deeper financial metrics.
These results help us determine how well the company performed over the quarter before diving into the 10-Q for the nitty gritty. Typically, I reserve reading the 10-Q for last, but you can fit that in however works best for you.
Next, I would refer to the earnings transcript and call via Quartr. Here we can see a scripted read from Tim Cook, CEO, and then the analyst’s Q&A at the end.
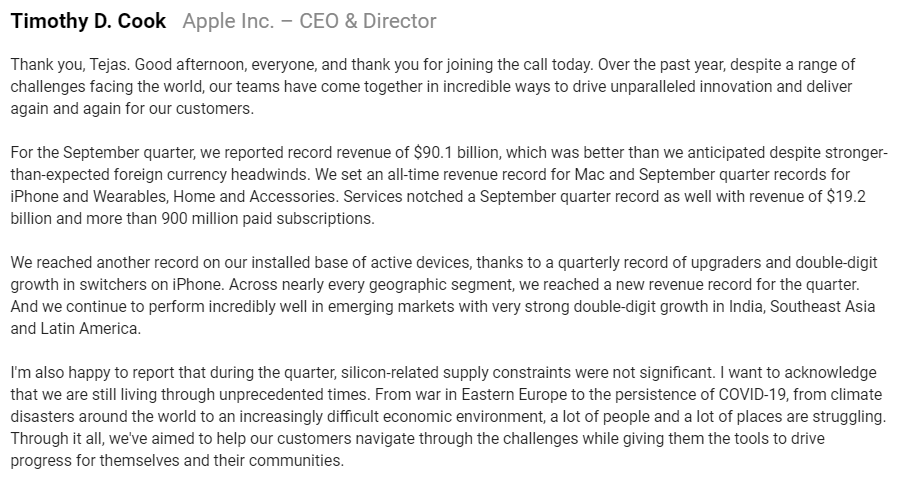
Typically, the scripted part of the call focuses on items the company wants to highlight. Sometimes they will provide more information here, but they tend to be by the book and don’t stray too far off the talking points.
Some CEOs use the beginning section to explain any trouble or struggles the company might have encountered.
Next, we have the analyst’s Q&A.
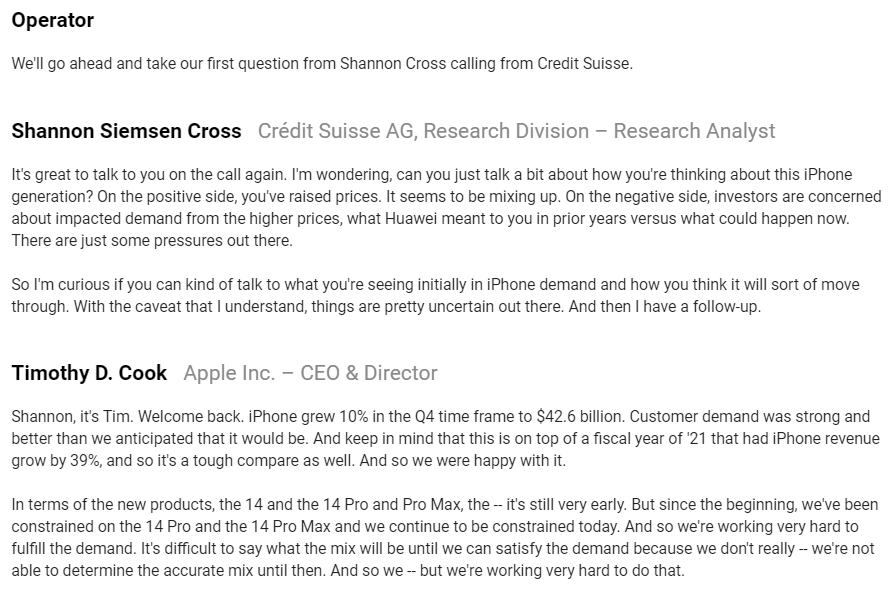
Here we can glean some valuable information. Many times the analyst will stick to the talking points but you can find some nuggets to help you better understand the company.
For example, we can find out what is important to the company by focusing on the subjects they refer to in their presentation and how they answer the questions from analysts.
We can also determine any risks or how much competition might impact the company. We can learn how they feel coming for their moat. Or we can learn how big a particular risk could impact Apple.
For much of the earnings call, it’s not necessarily the words they use but what questions they ask and how they answer. We can pick up subtle clues and insights from what is not said as much as what is said.
Next, we can look at the pictures from the presentation deck, which Apple doesn’t provide. The slides typically outline the company’s financial performance and strengthen the main points they focus on. Sometimes we can find deeper information on segment performance or a breakdown of revenue segments.
The last run-through is reading through the 10-Q, which gives us the nuts and bolts of the financials, some management commentary, and any market risks the company might face.
One note about the 10-Q filings: sometimes a company might not release them at the same time they release a press release or conduct an earnings call.
Investor Takeaway
Earnings season comes four times a year, and thousands of companies report their financial results. As investors, we must filter through these reports and determine what is important to us.
As long-term investors, we can use the earnings reports to help determine how a company is doing relative to their goals and ambitions. We can also determine how well a company continues to perform.
If a company starts to struggle, the earnings reports can help update us on the continued performance and help us determine whether the thesis remains intact.
The hardest part of the earnings season is removing ourselves from the hype and FOMO, which can be real. If you can detach yourself from the emotional part of the earnings season, we can learn a lot about each company during this time.
It’s important to focus on the metrics and KPIs (key performance indicators) which are key to our company and ensure they continue to perform.
And with that, we will wrap up our discussion on how to read earnings reports.
Thank you for reading today’s post; I hope you find something of value. If I can be of any further assistance, please don’t hesitate to reach out.
Sources:
https://public.com/learn/how-to-read-an-earnings-report
https://mywallst.com/blog/how-to-read-an-earnings-report-earnings-season-cheat-sheet
