If there’s one thing that I really have picked up on in my investing journey and I try to preach to you all is that we really need to challenge the status quo and think differently than the norm! I wanted to see if Dollar Cost Averaging was more advantageous to lump sum investing so I created a simple to use lump sum calculator!
First of all – what is dollar cost averaging?

Dollar cost averaging is simply breaking up your investing into many different purchases to “hedge your bets” in a sense. Essentially, your goal isn’t to necessarily win or lose, you just want to get invested at an average price and not time the market whatsoever.
For instance, let’s pretend that you want to purchase a stock and you’re willing to spend $12,000 in total in the investment. You can buy it all at once or spread it across any time period that might make you feel more comfortable!
For the purposes of this example, I am going to assume that you want to invest $1000/month over the course of a year. Take a look at the chart below to see how this situation might play out:
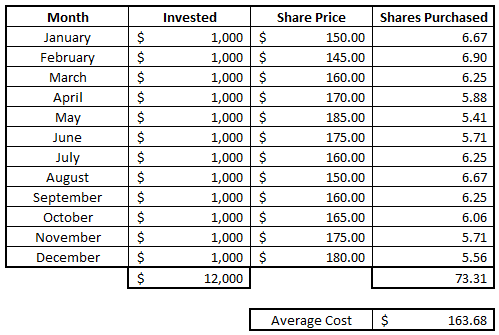
As you can see, the initial purchase price is $150, meaning that you could’ve bought all $12K at $150/share, but you also could’ve had the share price drop the entire time meaning you bought at the high point. If you’re dollar cost averaging, you don’t care. You just want to spread your money out equally into a position and not try to time the market.
In theory, this makes an absolute ton of sense, right? I don’t ever really want to time the market so I’ve always been a huge fan of dollar cost averaging but the more that I had thought about it, I wondered if it actually made sense to do this.
Every time that I am paid and money goes into my Roth IRA, I will then invest it in the market, typically into one of my current positions. I always thought that was dollar cost averaging, but is it?
I don’t think it is at all, actually. I’m basically just making biweekly lump sum investments. Sure, I a spreading out my investing over the course of the year, but that’s only because that’s when the money is available to me. If someone gave me $6K right off the bat at the beginning of the year, I would likely put it all then, right?
Dollar cost averaging is intentionally saving funds with the intent to invest them later solely to spread out your risk. I’ve always preached it that this is the way to go but ever since the coronavirus impact was really felt, I’ve really questioned if this was the right strategy.
When the coronavirus impact was really hitting hard, I took some money out of our emergency fund to “borrow” and basically just invest with it. I implemented the strategy to max out the Roth IRA as early as possible to take advantage of the market dropping so hard over something that I thought was a short-term impact in the grand scheme of my investing journey.
I made the conscious decision to essentially go against my normal advice and time the market and jump in. Sure, the market could’ve dropped even lower, but I was able to put a lot of money in when the market was down 25% so I felt very confident knowing that I was getting a good deal even if the market went back up.
The market has done nothing but go up, since forever, so in theory it makes sense to put as much in the market as early as you can, right? But that was just a theory, and it seemed to really go against all other advice that I had heard from people, so I really wanted to actually put some numbers to it and see how things would shake out.
So, I looked back at the historical data of the S&P 500 and ran two comparisons.
The first comparison is if I spread out my investments equally over a 2-week period for every week during the year. Note that this is not because this is how I was paid, but this would be if I had $260 in total on January 1st and decided to only invest $10 each week and just hold onto the remainder until two weeks later, where I would invest another $10, rinse and repeat.
The second scenario would be if I invested all $260 at the beginning of the year and then didn’t touch it at all. Then when the next year came, I would do the exact same thing.
I compared these two strategies to one another and looked at various returns in increments of 1, 5 and 10 years. How do you think it turned out?
Honestly, I was shocked at the results. In my mind, I thought that a lump sum would win because if the stock market has returned 11% on average per year, then you’d be theoretically better off taking the lump sum more often than not and just making sure your money got in the market sooner rather than later, but that was just my thought process.
You can see in the chart below that I broke the results down into four different time periods that all ended at the end of 2019 and have starting dates as of 1929 (the earliest I could get data), 1950, 1975 and 2000. Then, I took the average, median, max and min in timespans of 1 year, 5 years and 10 years. I also color coded it so you know that if it’s green, it’s better than the other side, and red simply means that it’s worse.
Take a look!
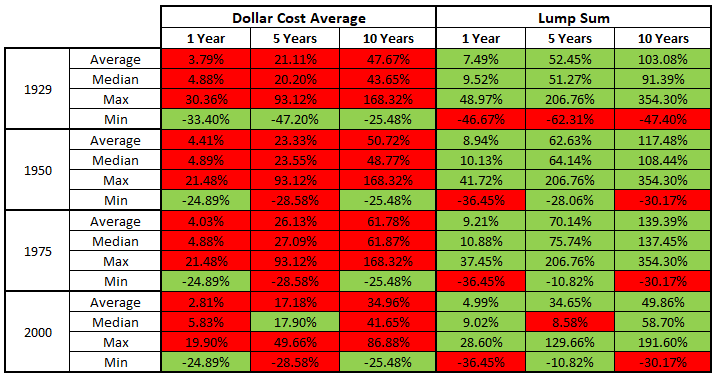
The very first thing that stood out to me is that there is A TON of green under the lump sum section. For the most part, I am a long-term investor, so the ‘average’ is what I care the most about. The ‘average’ for a lump sum is better for every single timeframe and in every single yearly increment. That is absurd!
I figured it would be closer at some points but it’s not even close at all. I mean, the 10-year time period is more than double every single Dollar Cost Average time period with the exception of 2000, and that’s really not even a good comparison because there’s only been 11 time periods in that range since starting in 2011, you don’t have ten full years of data.
But even if you’re a short-term investor, you’re still way better off getting your money in the market sooner rather than later. I assumed that you would likely see higher highs, or a ‘max’ and a lower low, or a ‘min’, but and that did turn out to be fairly true but honestly, I couldn’t care less!
I am a LONG-TERM investor (for the most part as I do have some short-term play money), so who cares what a great or an awful year look like? I want to see what things look like over a long period of time, so I really focus on the average and the median.
I am one that loves the saying that “time in the market beats timing the market” and I agree even more with this. I used to say this from an opinion of, “don’t worry about timing the market – just dollar cost average your way in and don’t worry about the highs and lows.”
Now I am totally changing my mindset and saying, “put all of your investing money into the market right now!”
Now, I do want to caveat that you still need to make sure that you’re being diversified and that you are picking great companies that are setup to be successful for many years to come, so don’t just dump your money in just to dump it in. But, if you find a great company and want to put in $6000, don’t plan to invest $500/month over the year – just put all $6K in now if you have it!
If you don’t have that much money, that’s fine. When you get it, invest it. I am not telling you that you need to put all of your cash into the market right now or that you need to do something drastic. What I am telling you is that holding onto cash, even if you have a plan to invest that cash in the future, is a losing strategy…just look at the math I showed you!
Don’t think that you need to invest all of your money at the beginning of the year or do something drastic now. I am still going to invest every 2 weeks when I get paid but if my plan is to put in $100, I am going to put all $100 in! Sure, this strategy might not have been a great one in the past, but now that so many brokerage firms offer zero commission trading and you can buy fractional shares, why wouldn’t you invest this way?
The point is that I am investing 100% of the funds that I have, when I get them, but ONLY if I am putting it into a company that I have great trust in. If I don’t know where I want that money to be, then I should never be investing it prior to doing more research!
I created a Lump Sum Calculator for you if you want to see the true impact that this might have on your investing journey. Of course, this assumes that the market is going to be perfectly predictable and give you the same return year on year, which we know never happens, but it since I’m using the same logic for both Dollar Cost Averaging and Lump Sum, it will be apples to apples.
All that you need to do is input the two variables that I have noted below:
CAGR (Compound Annual Growth Rate) – this is simply the amount that you expect your money to grow by every year
Annual Contribution – the amount that you anticipate investing every year
Once you input those two variables into the formula, you can see the results between dollar cost averaging and lump sum investing over a 50-year period!
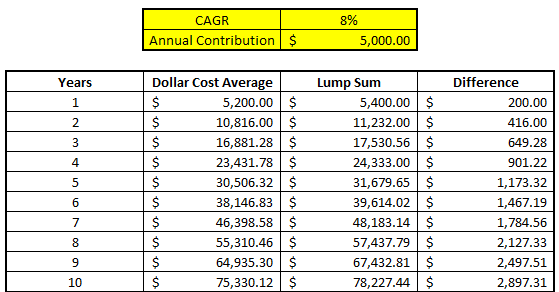
I only included a 10-year period in my screenshot but you can download the calculator for free below and adjust as you need for up to 50 years!
Like I mentioned, only so much can be assumed so I just used a middle of the road number for the dollar cost averaging, meaning that if the market goes up a perfect 8% the whole year and you’re equally balanced in your investments, then you’re going to have an average return of 4% because 25% were 0-2%, 25% were 2-4%, 25% at 4-6% and 25% at 6-8%. Basically, you protected yourself from losses but also hurt yourself from the major upside.
As you can see, with each year that passes, the difference between the strategies increases more and more in favor of the lump sum investing style.
From now on, I can say with 100% certainty that I am going to be a lump sum investor only and I really think that the proof is in the pudding. You need to make sure that you know yourself, though, because if you can’t take the risk of buying in for 100% of your position at the high point and then losing a lot, you need to probably stick with dollar cost averaging.
You see, the thing with personal finance is that it’s all personal. All of these tips and tricks are just strategies. These strategies might work with perfect math but we are not robots. Sometimes we will let our emotions get in the way when we’re looking at our portfolio and determining if we need to sell a stock.
Of course, the goal is always to stick to our checklist and never to get wrapped up into a big change in share price, but that is going to happen. And honestly, it’s why I recommend that you check your portfolio daily, which is probably the hottest take since this one that Dollar Cost Averaging is for the weak!
