Gross margin. Marketable securities. Earnings per share. These are all words you will find on the financial statements of publicly traded companies. Otherwise known as stocks. If you’ve never taken an accounting course, you likely have no idea what these terms mean.
Analyzing stocks can be daunting for first-timers. There is foreign-sounding language, confusing SEC documents (what even is the SEC?), and many metrics like the P/E, EV/EBITDA, and P/S.
You won’t master stock analysis in a day. In fact, you may never master it. Legendary investor Warren Buffett claims he is still learning new things about analyzing stocks, and he has been investing (with a fairly good track record, I may add) for nearly 80 years now. Even he has down periods.

Why, then, should anyone even attempt to learn stock analysis? Isn’t it too much work? Shouldn’t I just buy index funds?
Perhaps. But for those willing to take the plunge and buy individual stocks, there is the potential for life-changing wealth creation. For example, if you bought $10,000 worth of Netflix stock 20 years ago and held on until today, it would be worth over $1 million.
But it all starts with learning the basics. In this post, we will learn:
- What is Fundamental Analysis for Stocks?
- The Basics of Financial Statements
- Important Metrics and Financial Ratios (using Apple as an example)
- Resources to Learn More
What is Fundamental Analysis for Stocks?
Fundamental analysis is projecting a company’s financial performance and comparing it to the current value of its stock. Then, an investor decides whether the stock is undervalued or overvalued.
This is different from technical analysis, which trades a stock based on its historical price movements. We will be focusing solely on fundamental analysis today.
More specifically, fundamental analysis involves looking at a company’s position in an industry, its financial statements (i.e., how much it generates in profits), and then projecting its future profitability. Investors may look at other qualitative factors such as brand, economies of scale, and competitive advantages. However, today, we are mainly focusing on quantitative analysis.
The goal of fundamental analysis is to help you figure out your estimate of intrinsic value, which is your estimate of the value of a business. Then, you compare this estimate to the actual value the stock is trading at. If your value is significantly higher than what the market is valuing shares at, it might be smart to buy some shares for your portfolio.

One note: Fundamental analysis is not a precise science but far from it. There is no right answer to an intrinsic value estimate, with investors always disagreeing on the value of a stock.
Just look at the long-running debates around Tesla. Some investors think the company is poised to become the most valuable stock in the world, while others think it is doomed to crash and burn. Their respective intrinsic value estimates are wildly different, leading them to different conclusions about a stock.
This makes sense. If everyone agreed on the value of a company all the time, its price would never change. That’s what makes it a stock market and where the opportunity lies.
Okay, with that out of the way, let’s get into the details of how to perform fundamental analysis.
The Basics of Financial Statements
There are three financial statements:
- Income statement
- Balance sheet
- Cash flow statement
Every publicly traded company has to produce these financial statements for investors routinely. Typically, the easiest way to find them is to look at a company’s investor relations website.
An income statement will take a company’s overall sales in a period and itemize its expenses down to its bottom-line earnings power. For example, here is Apple’s latest income statement:
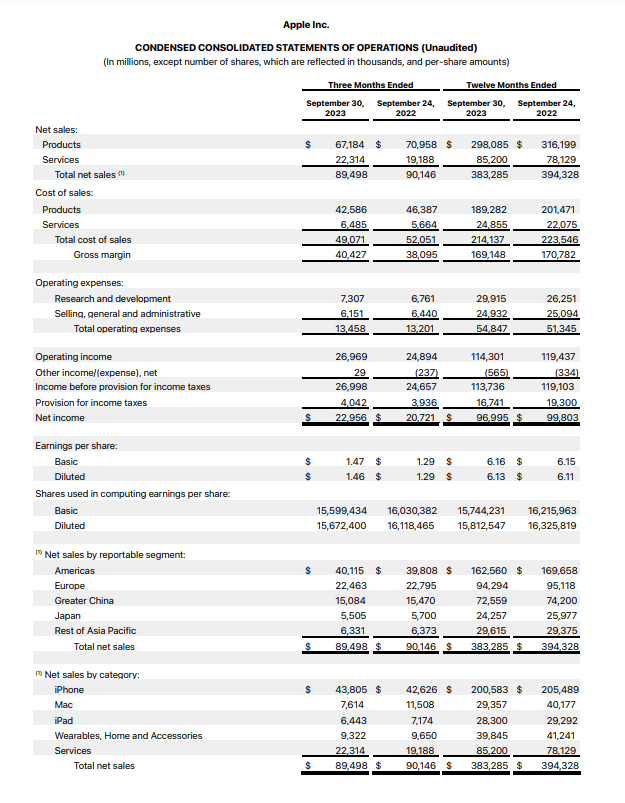
Seeing a financial statement can be overwhelming at first. There are a lot of numbers and terms you may not understand. More advanced investors will look at many of these line items when analyzing a stock like Apple.
As a beginner, the most important item on the income statement is net income. This tells you the company’s estimate – along with its auditor – of its earnings power.
Last fiscal year, Apple’s net income was $97 billion, down from $100 billion a year before (see if you can find both numbers in the above graphic). The absolute earnings power is important, but so is the trajectory of those earnings. For Apple, investors may be concerned that its earnings fell last fiscal year compared to the previous year.
A balance sheet classifies a company’s assets and liabilities and looks like this:
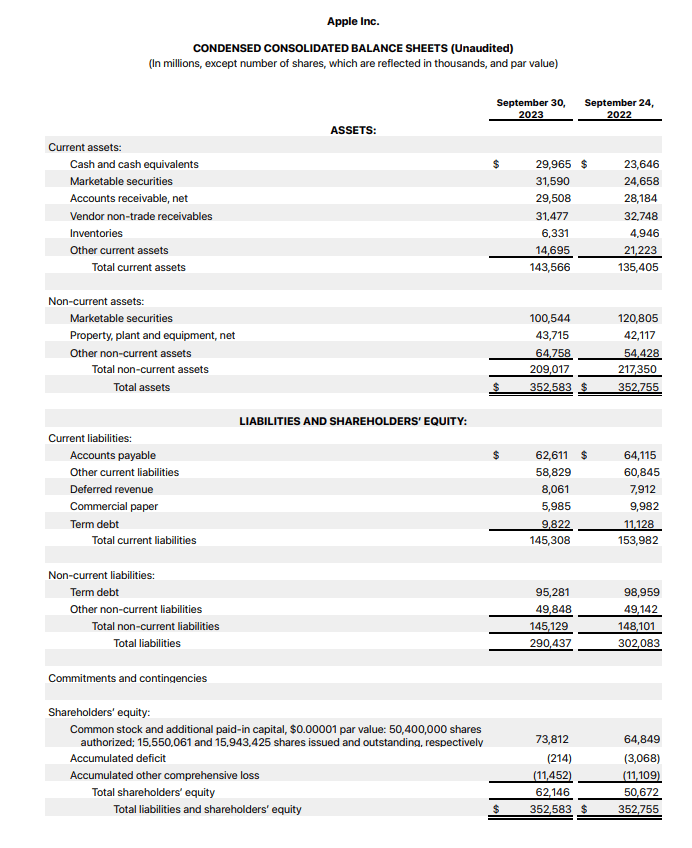
Similar to the income statement. There are a lot of items on a balance sheet that more advanced investors will pay attention to. For beginning investors, there are two items to calculate:
- The total value of its cash, cash equivalents, and investments
- The total value of its financial debt
You can calculate the sum of a company’s cash, equivalents, and investments fairly easily. For the above balance sheet, Apple had around $30 billion in liquid cash, $31.6 billion in short-term marketable securities, and $100.5 billion in long-term marketable securities on the asset side of its balance sheet. Add these three numbers together, and we get $162.1 billion.
To get the total value of a company’s financial debt, we need to look at the liabilities section of the balance sheet. From the above graphic, we find commercial paper ($6 billion), short-term debt ($9.8 billion), and long-term debt ($95.3 billion). Add these together, and the total value of Apple’s financial debt is $111.1 billion.
Why do we care about these two figures? Because it can give investors a rough estimate of a company’s enterprise value, or the full measure of its value assumed by its stock price. To calculate enterprise value, you take a stock’s market cap, subtract its cash, equivalents, and investments, and then add its total financial debt.
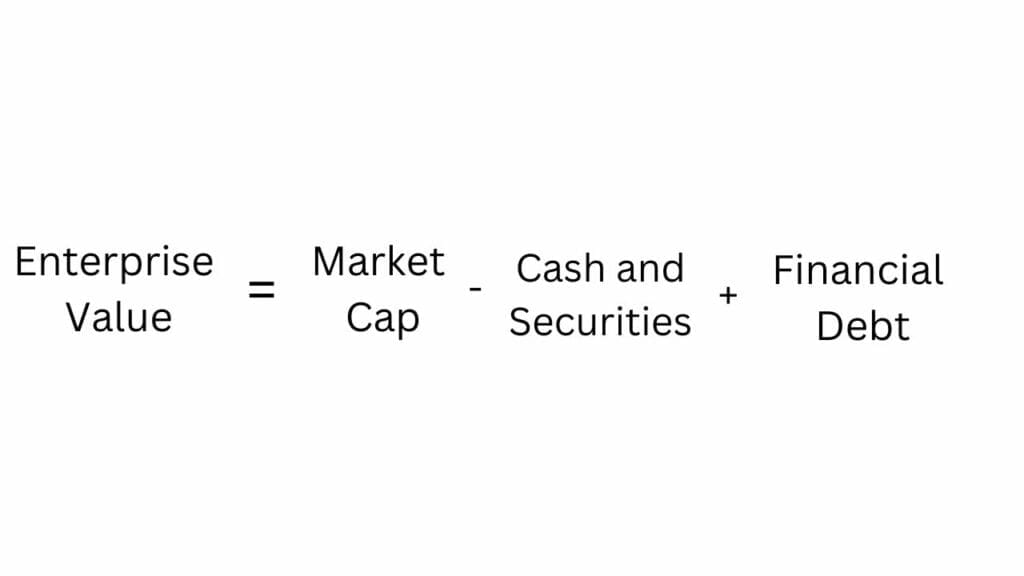
If you don’t know what a market cap is, it is the value of its stock in the public markets and is taken by multiplying the current share prices by the current number of shares outstanding.
Lastly, we have the cash flow statement. A cash flow statement reconciles a company’s net income with the balance sheet to tell an investor how much cash was brought in (or lost) over a certain period and why. Here is Apple’s cash flow statement:
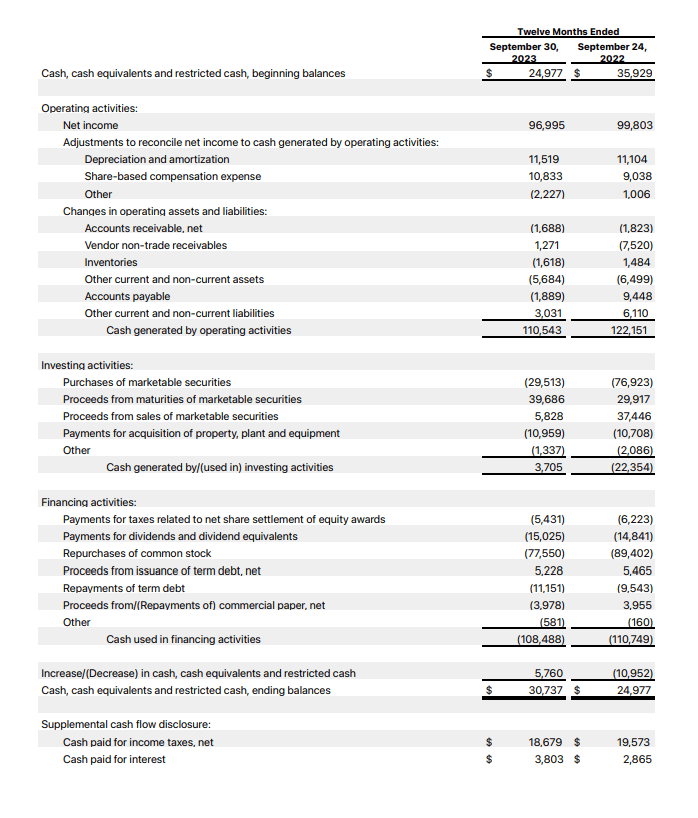
The most important cash flow measure on the cash flow statement is one that is not listed: free cash flow. Free cash flow is the lifeblood of a company and tells an investor how much cash will be available to be returned to investors through dividends or share repurchases.
For decades, investors have debated the best way to calculate free cash flow, but as a beginner, let’s go with the simplest definition. Free cash flow is calculated by subtracting capital expenditures from operating cash flow.
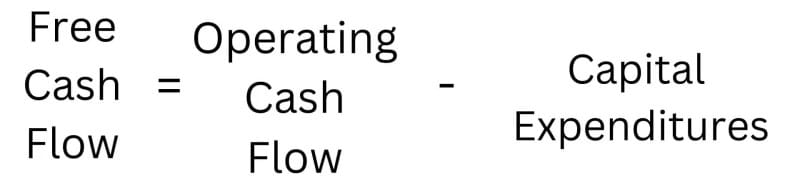
From the above graphic, Apple generated $110.5 billion in operating cash flow last fiscal year. Its “purchases of property and equipment” (a different term for capital expenditures) was $11 billion. Therefore, its “free cash flow” was just under $100 billion for the fiscal year.
This is just the tip of the iceberg when analyzing the three financial statements. Don’t expect to learn everything in one day, but this section should summarize the most important basics beginners need to understand. Mainly:
- Obtaining net income from the income statement
- Calculating enterprise value from the balance sheet
- Calculating free cash flow
Important Metrics and Financial Ratios
So, we now have three new terms – free cash flow, net income, and enterprise value – that we can calculate for any public company. But how do we use this information to analyze a stock?
The next step is to take these terms and calculate some financial ratios. Investors may use dozens of different financial ratios, but today, we will focus on two:
- Price-to-earnings (P/E)
- Enterprise value-to-free cash flow (EV/FCF)
The P/E (this is how you will see it commonly written) is a simple formula. It divides a company’s market cap by its full-year net income. Sticking with Apple, it has a market cap of $2.9 trillion. With $97 billion in trailing net income, that equates to a P/E of 30.
An investor can compare a P/E to other stocks in a company’s sector or perhaps the broad market. Apple’s P/E of 30 is slightly above the S&P 500 average of 27.
Investors can also invert a P/E (taking trailing net income and dividing it by a market cap) to get a stock’s earnings yield. This is similar to a bond yield – although more dynamic – and tells an investor how much net income they earn each year when buying a stock at current prices.

The EV/FCF is less common than the P/E but perhaps a better measure of the true earnings power of a business. It is another simple calculation, taking a stock’s enterprise value and dividing it by its free cash flow. For Apple, it has an enterprise value of $2.849 trillion. Last fiscal year, it generated $100 billion in free cash flow.
Running the calculation gives Apple stock an EV/FCF of 28.5. So, very close to the P/E but slightly lower.
Sometimes, a stock will have an EV/FCF close to its P/E, as Apple does. But other companies will have wildly different numbers. Generally, it is better to analyze a stock when considering its net debt position on the balance sheet and how much cash flow it is actually generating for shareholders, which is why I think EV/FCF is superior to P/E. Both are useful though.
Other ways to estimate intrinsic value include using forward earnings estimates or even performing a discounted cash flow. For a beginner, calculating a trailing P/E and EV/FCF for a stock is the best place to start.
What do the P/E and EV/FCF tell us? How do I use it for fundamental analysis? It always involves context with the broader market, what sector a stock is in, the management team, and the growth trajectory of the specific company. Plus, other things. But all else equal, the lower the P/E, the cheaper a stock is, and the higher the P/E, the more expensive a stock is.
Performing these calculations will help you estimate intrinsic value, which at the end of the day is the whole point of stock analysis.
Resources to Learn More
There isn’t a step-by-step recipe to analyze a stock. It is more art than science and involves qualitative and quantitative factors. Your process for analyzing a company will also assuredly evolve as you continue learning.
For beginner investors, ambiguity can lead to an illusion of choice. It is hard to know what to learn without a concrete step-by-step path. After reading this article, I hope you understand the importance of the three financial statements, the important metrics found on these financial statements, and the two basic earnings ratios (P/E and EV/FCF). Investors of all skill sets will use these ratios. It is a great place for any beginner to start.

How I Recommend Getting Started
To improve your skills, I recommend picking a stock of your choosing, perhaps one whose brand you know well. Crack open its investor relations website, find its financial statements, and perform the same analysis we did on Apple with them. Then, repeat it with another stock. And another. There are thousands of publicly traded companies to choose from. You’ll never run out of new documents to read.
Once you’ve gotten the basics, you can move on to the more immediate and advanced stock analysis topics such as company competitive advantages, discounted cash flows, and expectations investing.
Here are three resources to further your learning:
- Warren Buffett’s annual letters to shareholders. Buffett has been publishing his annual letter for decades, which are always full of wisdom and written in a way novice investors can understand. You can find them for free at the Berkshire Hathaway website.
- Reading papers written by Michael Maoboussin. The adjunct professor and Morgan Stanley employee has been a research machine for years, producing some of the seminal work of modern investing. He hits on more advanced topics, so don’t read these unless you’ve mastered the basics. You can find his writing on his website.
- Read One Up On Wall Street by Peter Lynch. Peter Lynch is a legendary mutual fund manager who wrote one of the most digestible books for investors to learn from. The book is helpful for understanding the qualitative factors of a company that can drive investment returns.
Oh, and it wouldn’t hurt to check out some episodes of the Investing For Beginners Podcast, either. Listen to episodes on Spotify, Apple, or wherever you get your podcasts.

Brett Schafer
Brett Schafer is an investor, host of the Chit Chat Stocks Podcast, and writer at the Motley Fool.
