“Accounting is the language of business.”
Warren Buffett
This brief quote underscores Buffett’s belief that a deep understanding of financials and accounting remains essential for investors and business leaders.
By “speaking” and “understanding” this language, individuals can make informed financial decisions, evaluate investment opportunities, and assess the financial health of companies.
In today’s post, we will learn:
- Importance of Financial Statements
- Overview of Income Statement
- Overview of Cash Flow Statement
- Overview of Balance Sheet
- How the Financial Statements Interconnect
Let’s dive in and learn how the three key financial statements interconnect.
Importance of Financial Statements
Understanding financial statements is like deciphering the secret code of a business. It’s not just for the experts; anyone can learn it, and it’s super important for investors.

Think of it as your roadmap to making smart decisions with your money.
First, let’s talk about what financial statements are. They’re like a report card for a company, telling you how well it’s doing. There are three main types:
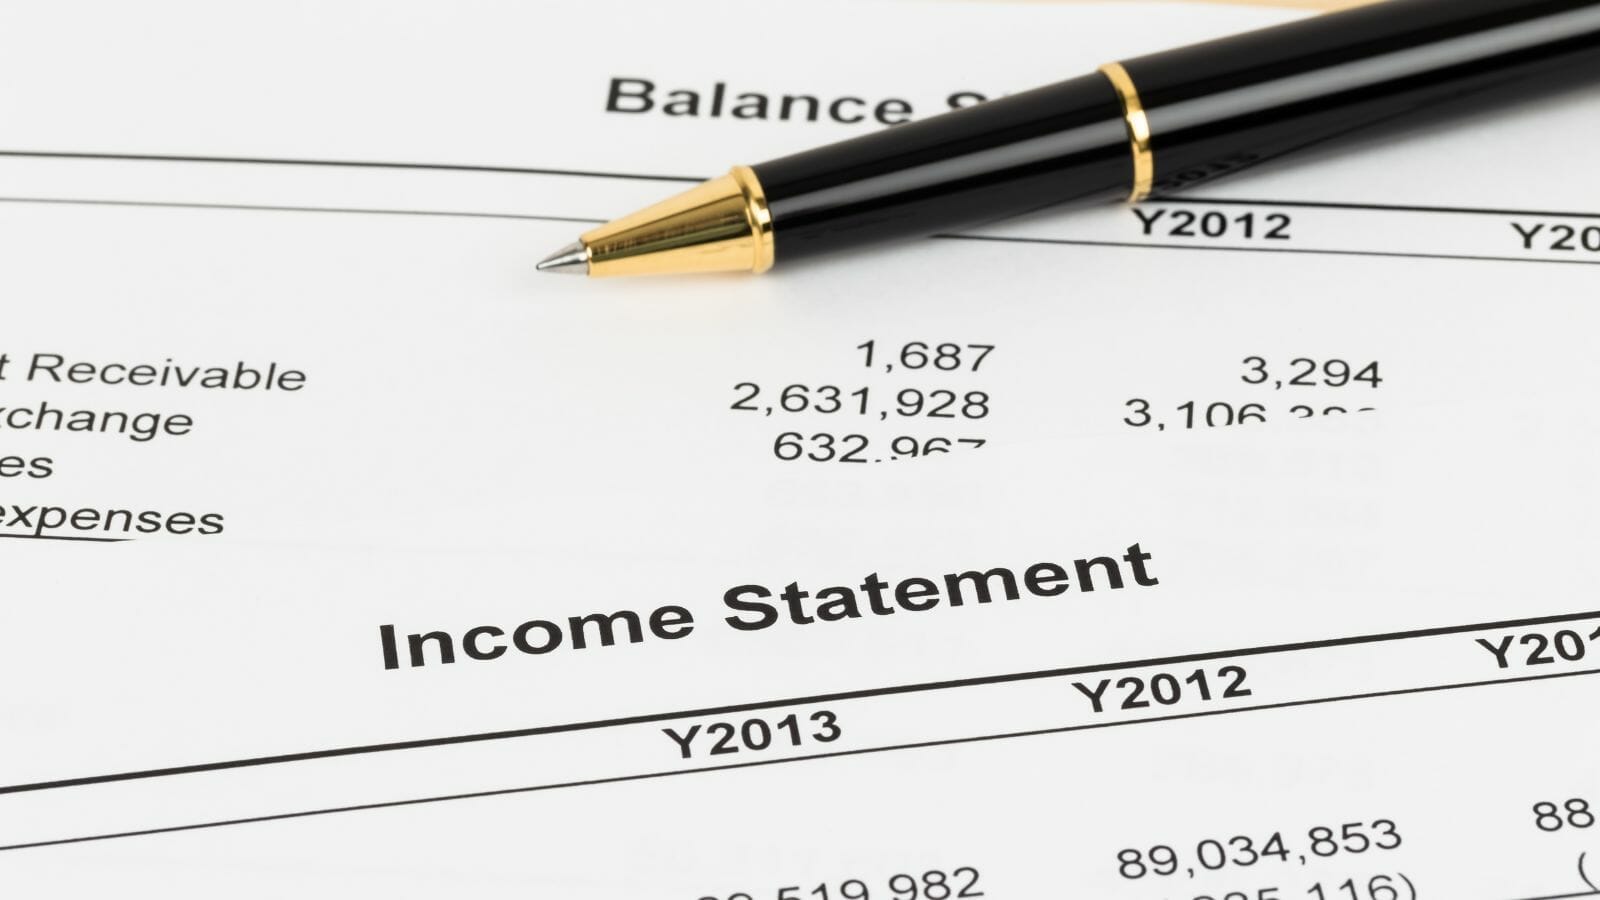
The income statement shows how much money the company made and how much it spent during a specific time, like a year or a quarter. It’s like looking at your allowance and spending to see if you saved any.
The balance sheet is like a snapshot of the company’s financial health at a particular moment. It lists what the company owns (assets) and what it owes (liabilities). If your piggy bank and IOUs are in good shape, that’s like a healthy balance sheet.
The cash flow statement tracks the money going in and out of the company. It’s like keeping an eye on your checking account – how much you’re getting and how much you’re spending.
So, why are these financial statements crucial for investors, especially those just starting investing?
1. Informed Decisions: Understanding financial statements helps you make informed decisions. You can see if a company is making money or losing it. If it’s losing money, you might think twice about investing.
2. Spotting Trends: Financial statements let you spot trends. Are sales going up, or are they dropping? Is the company taking on too much debt? Trends can help you predict the future.
3. Comparing Companies: You can compare companies’ financial statements to see which is doing better. It’s like choosing the best player for fantasy sports (baseball).
4. Risk Management: Knowing how to read financial statements helps manage risks. You can see if a company is too risky or if it’s a safe bet for your money.
To sum it up, understanding financial statements is valuable for investors. It’s like having a superpower that helps you make wise choices with your money.
Overview of Income Statement
Imagine you’re reading a book about your favorite superhero’s adventures. In the world of business and finance, the Income Statement is like that book. It tells the exciting story of a company’s financial performance during a specific time, like a year or a quarter.
Purpose of the Income Statement:
So, why do we need this financial storybook?
Its main job is to summarize how much money a company made and how much it spent during that period. It’s like checking your piggy bank to see how much allowance you’ve saved and how much you’ve spent on snacks, toys, and games.
The Income Statement is crucial for investors, analysts, and the company. It gives them a clear picture of whether the company is making a profit (a good thing) or facing a loss (not so great).
Key Terms:
To understand the Income Statement, we need to know some key terms:
– Revenues: A company earns dollars from its primary business activities, like selling products or services. Think of it as the money coming in. Also known as the top line or sales.
– Expenses: These are the company’s costs to run its business, like employee salaries, rent, and materials. It’s the money going out.
– Gains: Sometimes, a company makes extra money from activities not part of its core business, like selling a building for more than it’s worth. These are gains, like winning a prize.
– Losses: On the flip side, if a company loses money from those extra activities, it’s a loss, like a little setback.
Calculating Net Income:
Now, let’s dive into the math part.
To find out if a company ended up with more money or less after all is said and done, we calculate something called “Net Income” or “Net Loss.” We can also refer to net income as earnings, net earnings, or bottom line; these terms remain interchangeable.
Net Income = Revenues – Expenses + Gains – Losses
Think of it as a simple equation. You start with all the money the company earned (revenues) and subtract what it spent (expenses). Then, you add any extra money from gains and subtract any losses. The result is either a positive number (profit) or a negative one (loss).
Net Income is super important because it’s the starting point for the other financial statements, like the Balance Sheet and the Cash Flow Statement.
It tells us if the company has money to invest, pay dividends to shareholders, or pay off debts. It shows where the company needs to improve if it’s a loss.
So, when you read a company’s Income Statement, you’re not just crunching numbers. You’re uncovering the financial story behind the business, whether it’s a tale of success and profit or a challenge that needs conquering.
It’s like being Sherlock Holmes in a financial mystery; the Income Statement is your guide to solving it!
Overview of Cash Flow Statement
When you’re curious about where your cash went, you might keep a checking account ledger.
Companies also have their version of that ledger called the Cash Flow Statement. This financial report is like a treasure map, tracking how cash and cash equivalents move in and out of a company during a specific period.
The Cash Flow Statement’s Role:
So, what’s the big deal with this statement?
Well, it’s all about the cash. The Cash Flow Statement shows us where a company’s money is coming from and where it’s going. It’s like tracing the journey of your cash from your wallet to the store and back.
The statement is essential for investors, company management, and lenders.
It helps them understand if the company generates enough cash to cover expenses, pay debts, invest in growth, and reward shareholders.
Three Main Sections:
The Cash Flow Statement contains three main sections, each revealing a different aspect of the company’s cash adventure:
1. Operating Activities: This section shows the cash flows from the company’s core business operations. It begins with the net income from the Income Statement but adjusts it for non-cash items (like depreciation and amortization) and changes in working capital (like changes in accounts receivable and accounts payable). It’s like counting the money you earned from work and subtracting the stuff you bought.
2. Investing Activities: Here, you see the cash flows related to the company’s investments, including buying and selling assets like property, equipment, or investments in other companies. Imagine if you used your cash to buy a new car or sold your old video games – that’s what this section is about.
3. Financing Activities: This section focuses on cash flows related to the company’s financing. It includes borrowing money, repaying loans, or issuing and buying back stock. Think of it as taking a loan to buy a big-ticket item (car) or paying back a friend.
Adjusting Net Income:
Now, let’s dig into the nitty-gritty of the operating activities section. It all starts with the net income from the Income Statement. But, we need to make a few adjustments to get the real cash flow from operations.
First, we add back non-cash expenses like depreciation. These are costs that don’t involve actual cash leaving the company. It’s like saying, “Hey, we didn’t spend this money; it’s just an accounting thing.”
Next, we look at changes in working capital. This includes accounts receivable (money customers owe the company) and accounts payable (money the company owes suppliers). If accounts receivable go up, customers owe more money not yet collected. So, we subtract it to get the cash flow.
Conversely, if accounts payable go up, the company owes more money but hasn’t paid it yet. So, we add it back to the cash flow.
Reconciliation with the Balance Sheet:
Finally, we need to make sure our cash flows match the changes in cash and cash equivalents reported on the Balance Sheet. It’s like double-checking your spending diary to ensure the numbers add up.
If the company’s cash and cash equivalents increased during the period, they received more cash than they spent. But if it went down, they spent more than they received – something to watch out for.
Putting it all together, the Cash Flow Statement is like Sherlock Holmes, helping us track where a company’s cash goes and how it moves.
Anyone interested in a company’s financial health must ensure the money stays on the right track.
Overview of Balance Sheet
Have you ever taken a snapshot to capture a moment?
Well, think of the Balance Sheet as a snapshot, but instead of capturing a moment, it captures a company’s financial position at a specific time. It’s like a freeze-frame of a company’s money situation.
The Fundamental Equation:
At the heart of the Balance Sheet lies a fundamental equation:
Assets = Liabilities + Shareholders’ Equity.
This equation is like the foundation of a house. Let’s break it down:
– Assets: These are like all the things a company owns. It includes cash, buildings, machines, and even money that customers owe the company. Think of it as everything in your home – furniture, appliances, and even the money you saved.
– Liabilities: These are like all the debts and obligations the company owes to others. It can be money owed to suppliers, loans, or other financial responsibilities. Imagine if you borrowed some money from a bank; that’s your liability.
– Shareholders’ Equity: This is like the owners’ claim on the company’s assets after paying off all the debts (liabilities). It’s also called “net assets.” A part of shareholders’ equity is the “retained earnings,” which is the money the company has earned over time and kept (not paid out as dividends). It’s like your savings after you’ve paid off your debts.
Components of the Balance Sheet:
The Balance Sheet has three main components:
1. Assets: This section lists all the things a company owns. It includes current assets (like cash and accounts receivable) and non-current assets (like property and investments).
2. Liabilities: Here, you see all the debts and obligations the company owes to others. It includes current liabilities (like accounts payable) and non-current liabilities (like long-term loans).
3. Shareholders’ Equity: This section shows how much of the company’s assets belong to the shareholders. It includes common stock (shares the owners have), additional paid-in capital (money from selling shares), and retained earnings (profits the company kept).
The Impact of Net Income:
Remember that fundamental equation?
Well, the net income from the Income Statement plays a crucial role in the Balance Sheet. When a company makes a profit (net income), it doesn’t just disappear. It increases the shareholders’ equity, specifically in the “retained earnings” part.
It’s like when you save some of your cash in your savings account. The saved money equals your retained earnings. So, when a company makes money, it goes into the savings account (retained earnings), making the shareholders’ equity bigger.
In a nutshell, the Balance Sheet is like a financial snapshot, showing us what a company owns (assets), what it owes (liabilities), and what’s left for the owners (shareholders’ equity). It’s a picture of a company’s financial health at a particular moment.
How the Financial Statements Interconnect
Financial statements might seem like separate puzzle pieces, but they’re more like interconnected gears in a complex machine.
These statements—Income Statement, Balance Sheet, and Cash Flow Statement—work together to tell the story of a company’s financial health. Let’s dive into how they interconnect and influence one another.
Impact on Shareholders’ Equity:
Imagine you’re tracking your cash in an Excel worksheet, where each page represents a different financial statement.
The Income Statement is like the first page, showing your earnings and expenses.
When you make money (net income), the numbers carry over to the Balance Sheet, specifically to the “shareholders’ equity” section.
When a company makes a profit, they record it as net income on the Income Statement. This profit doesn’t disappear into thin air; it accumulates in the “retained earnings” section of the Balance Sheet, increasing shareholders’ equity. It’s like saving a part of your allowance each week; over time, your savings grow.
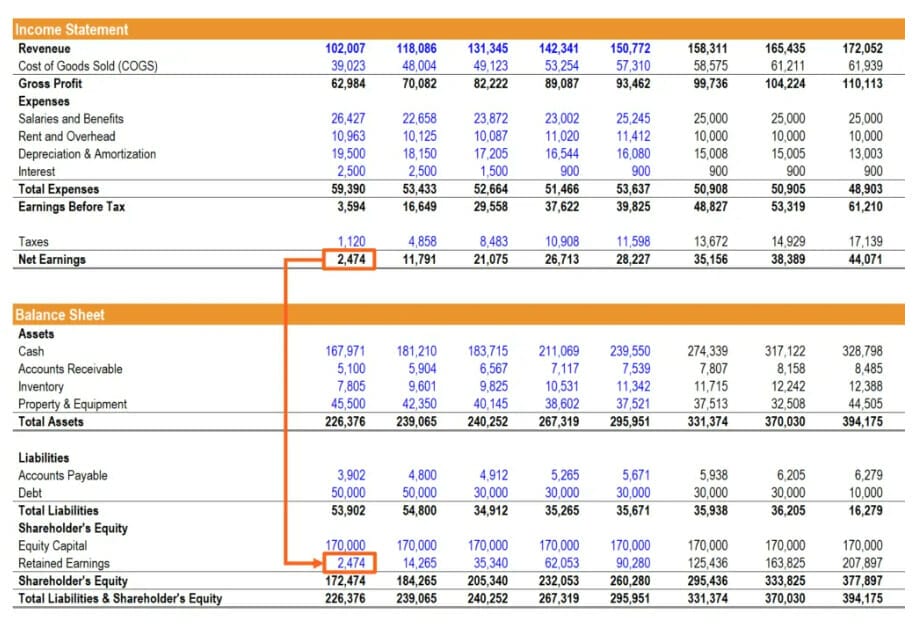
Image courtesy of Corporate Finance Institute
Cash Flow and the Balance Sheet:
Now, let’s discuss the Cash Flow Statement and its connection to the Balance Sheet.
The Cash Flow Statement helps track the movement of cash and cash equivalents. It’s like the spending Excel spreadsheet you keep for your salary.
In the Cash Flow Statement’s “Operating Activities” section, you calculate cash flows from your core activities.
You start with net income from the Income Statement because it’s the starting point for your financial journey. But here’s the twist: you adjust it. Just as you might note non-cash items (like money you haven’t received yet) in your spending diary, the Cash Flow Statement adds back non-cash expenses like depreciation.
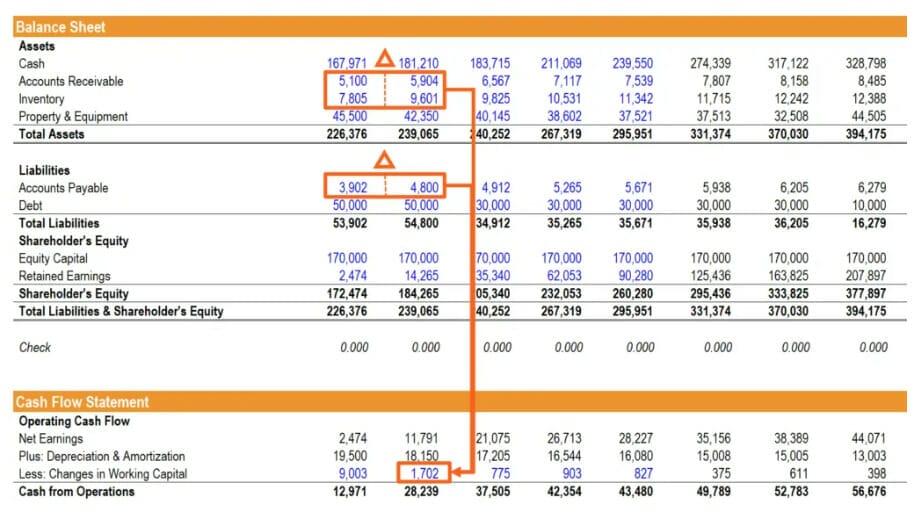
Image courtesy of Corporate Finance Institute
Then, you consider changes in working capital. If someone owes you money, it’s like accounts receivable, and you subtract it. But if you owe someone money, it’s like accounts payable, and you add it back.
These adjustments ensure your cash flow matches the changes in your cash on the Balance Sheet.
Investing and Financing Activities:
The Cash Flow Statement’s other sections, “Investing Activities” and “Financing Activities,” also have a say in the Balance Sheet’s tale.
In “Investing Activities,” you account for buying and selling assets like your friend selling their baseball card collection. If a company buys new equipment or sells property, those transactions affect the Balance Sheet’s “assets” section.

Image courtesy of Corporate Finance Institute
“Financing Activities” involve things like taking out loans or issuing stock. It’s like borrowing money from a friend or getting an extra allowance from your parents. These activities impact the company’s liabilities and shareholders’ equity on the Balance Sheet.
For instance, if a company takes out a loan, it increases its liabilities (the money it owes). Conversely, if it issues more shares, it raises funds and boosts shareholders’ equity.
These financial statements create a symphony of numbers that help us understand a company’s financial performance. They’re not isolated documents but interconnected chapters in the same financial story.
The net income from the Income Statement feeds into the Balance Sheet’s shareholders’ equity. The Cash Flow Statement keeps tabs on how cash moves in and out, ensuring it reconciles with changes in the Balance Sheet’s cash. Activities in the Cash Flow Statement, like investing and financing, leave their mark on the Balance Sheet, affecting assets, liabilities, and shareholders’ equity.
Investor Takeaway
In conclusion, the three financial statements—Income Statement, Balance Sheet, and Cash Flow Statement—are not isolated documents but rather interconnected facets of a company’s financial narrative.
Understanding how they relate is essential for deciphering a company’s financial health.
These financial statements work together harmoniously, creating a comprehensive financial story.
By recognizing their interconnectedness, investors and analysts can gain a deeper insight into a company’s financial performance, making more informed investment decisions and understanding the intricate dance of money within an organization.
And with that, we will wrap up our discussion today, learning how the three financial statements interconnect.
Thank you for reading today’s post, and I hope you find something of value. If I can further assist, please don’t hesitate to reach out.
Until next time, take care and be safe out there,
Dave
