One of Warren Buffett’s favorite metrics to measure a business’s efficiency to grow revenues is the metric, ROIC, or return on invested capital. When Buffett or Charlie Munger discuss potential investments, they mention that the best businesses can grow without investing much-invested capital. One way to measure how efficiently a company reinvests back into the company uses a lesser-known ratio called the sales to capital ratio.
One of my valuations’ missing aspects was measuring the impact that ROIC has on my cash flows. In the past, some of my valuations seemed a little too enthusiastic, and one of the aspects missing was the impact of invested capital on those cash flows.
When Verizon reinvests its cash flows back into the company, it helps grow the company’s revenues, so there is a real cash outlay for those investments. And excluding that impact affects the estimation of the fair value of a company.
In today’s post, we will learn:
- What is the Sales to Capital Ratio?
- The Impact of the Sales to Capital Ratio
- How to Calculate the Sales to Capital Ratio
- Practical Examples of the Sales to Capital Ratio
Okay, let’s dive in and learn more about the sales to capital ratio.
What is the Sales to Capital Ratio?
The sales to capital ratio, also known as the capital turnover ratio or sales to working capital ratio, is an efficiency ratio. The sales to capital ratio tell us how efficiently a company can turn one dollar of capital into one dollar of revenue.
It relates to the return on invested capital metric in it allows us to take the ratio and show the impact on the company’s cash flows. Before going forward, let’s talk about the return on invested capital for a moment.
Return on invested capital allows an investor to measure the impact on each dollar invested in the company and how that converts to growing revenues. Invested capital contains many parts, including debt and equity. Those are the tools that help grow the revenues of a company. Take debt for a moment; adding debt gives the company extra cash to grow its revenues by buying more assets that drive its revenue.
For example, if a company uses debt to build out its network of 5G small packs around larger cities; in the case of Verizon, that spending allows the company to offer new and additional services to its customers. Those new and additional services can help Verizon grow or retain its user base and drive more revenue.
The addition of new debt, especially at current low rates, allows the company to create more value for less than the reinvestment cost.
To calculate the return on invested capital, we need a few inputs:
- Operating income
- Income taxes
- All of which becomes NOPAT (net operating income after taxes)
- Shareholders’ Equity
- Book value of Debt
- Cash and Cash equivalents
So, for example, the ROIC for Verizon for the year ending 2020, taking the numbers from the latest 10-k:
Operating Income | $31,399 |
Income Taxes | $4,427 |
NOPAT | $24,051.63 |
Book Value of Debt | $122,948 |
Shareholder Equity | $69,247 |
Cash & Cash Equivalents | $22,171 |
Let’s put together with the following formula:
ROIC = NOPAT / (Debt + Shareholders’ Equity – Cash)
ROIC = $24,051.63 / ($122,948 + $69,247 – $22,171) = 14.14%
For a deeper dive into this all-important metric, please check out the below articles:
- How to Calculate Invested Capital for ROIC (the right way)
- How to Calculate NOPLAT for Operating ROIC
- Everything to Know about ROIC, with Average ROIC by Industry Data
- WACC vs. ROIC: Is Shareholder Value Being Created or Destroyed?
As you can see, we have spent a lot of time researching and analyzing these important metrics’ importance. As an aside, Professor Aswath Damodaran also focuses on this accounting metric to help assess companies’ efficiencies in investing its capital.
How to Calculate the Sales to Capital Ratio
Calculating the sales to capital ratio is a simple process; the ratio is:
Sales to Capital Ratio = Sales / Invested Capital
Where the inputs are:
- Sales or revenues
- Invested Capital
- Debt
- Shareholder Equity
- Cash & Equivalents
Let’s take a look at the sales to capital ratios of the big three of the telecom sector, Verizon (VZ), AT&T (T), and T-Mobile (TMUS).
First up, Verizon, and I will pull up the 10-k and locate each of the items to calculate the ratio.
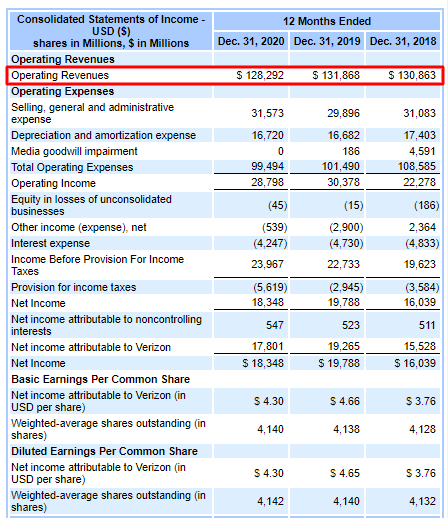

We are pulling the highlighted numbers for our inputs from both the income statement and balance sheet.
Revenues | $128,292 |
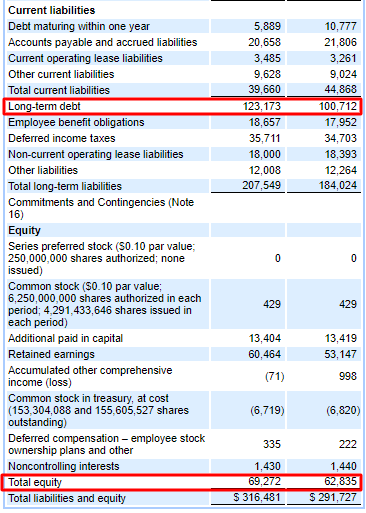
Long-term Debt | $123,173 |
Shareholders’ Equity | $69,272 |
Cash & Equivalents | $22,171 |
Now to plug those above numbers into the ratio, we find:
Sales to Capital Ratio = Revenues / Invested Capital
Sales to Capital Ratio = Revenues / (Debt + Shareholders’ Equity – Cash)
Sales to Capital Ratio = 128,292 / (123,173 + 69,272 – 22,171)
Sales to Capital Ratio = 128,292 / 170,274 = 0.75
Pretty simple, huh? Okay, now I will do the same for both AT&T and T-Mobile so we can compare all three companies.
Revenue | $171,760 |
Debt | $175,977 |
Shareholders’ Equity | $161,673 |
Cash | $9,740 |
Sales to Capital Ratio | 0.52 |
Revenue | $68,397 |
Debt | $94,709 |
Shareholders’ Equity | $65,344 |
Cash | $10,835 |
Sales to Capital Ratio | 0.45 |
We will cover the impacts a little more in the next section, but Verizon carries the companies’ highest sales to capital ratio compared to all three of the big telecoms. If we look at their ratios and compare them to the industry average of 0.84, all three are lower than those averages.
Let’s look quickly at the sales to capital ratio of some bigger names in the market, the biggest market caps:
- Apple – 3.56
- Amazon – 4.13
- Microsoft – 2.46
- Tesla – 2.31
- Google – 1.65
The Impact of the Sales to Capital Ratio
To assess the impact of return on invested capital, we need to look at how it affects the fair value calculations via a discounted cash flow model.
If we look at the sales to capital ratio and compare them to the ROIC of the above companies, I think we might find something interesting.
Company | ROIC | Sales to Capital |
Verizon | 14.14 | 0.75 |
AT&T | 6.76 | 0.52 |
T-Mobile | 3.80 | 0.45 |
And then if we compare the above largest market caps, we see:
Company | ROIC | Sales to Capital |
Apple | 25.94 | 3.56 |
Amazon | 12.40 | 4.13 |
Microsoft | 29.40 | 2.46 |
22.51 | 1.65 |
The above charts highlight the importance of efficiency. If we look at both charts, we see the higher sales to ratio capital indicate companies that are more efficiently using their free cash flow to grow their business value. To put that into a little context, for every $0.75 in additional revenues Verizon creates, it takes one dollar to create. Amazon creates $4.13 of additional revenue per $1 of reinvested capital, an efficient company.
For example, Verizon has a higher ROIC and sales to capital ratio, indicating the company is doing a great job of growing revenues from its debt and equity. And then, if we look at Amazon, they are doing a ridiculously good job of growing revenues from its invested capital, compared to companies such as Google and Microsoft.
As we will see in a moment, the higher the ratio, the less reinvestment the company needs, driving higher free cash flows and higher valuations.
Okay, let’s look at see how this impacts free cash flows and valuations.
To construct a free cash flow model to the firm, which is the most common use of free cash flow models, we need to see the flow of revenues to operating free cash flow, subtracting income taxes, giving us the free cash flow of the firm.
Below is the common use of the model:
Revenues | $128,292 |
Operating Margin | 24.47% |
Operating Income | $31,399 |
Tax Rate | 23.40% |
Free Cash Flow to the Firm (FCFF) | $24,051.63 |
But after working through Professor Damodaran’s valuation classes online, I noticed that my valuations always seemed to come out higher, and because of my more conservative nature, they bugged me.
Instead, I noticed that he includes a line item that accounts for the reinvestment of invested capital critical to revenue growth.
So, the better model is like this:
Revenues | $128,292 |
Operating Margin | 24.47% |
Operating Revenues | $31,399 |
Tax Rate | 23.40% |
EBIT | $24,051.63 |
Reinvestment | $5,131.68 |
Free Cash Flow to the Firm | $18,919.62 |
The above is an example of Verizon’s DCF valuation I performed as I prepared for this post. The next question is how do we translate the sales to capital ratio and the reinvestment of the ROIC for Verizon?
Here is the proper formula:
Reinvestment = Change in revenues / Sales to Capital Ratio
So, for example, let’s say that Verizon had a growth in revenues of 3% from one year to the next, then our change in EBIT would change by 3%, then we subtract from the previous year’s revenue to get the change in dollars, then divide that by the sales to capital ratio of 0.75.
Last Year | This Year | Change |
$128,292 | 132,140.76 | $3,848.76 |
Now we take the change in revenues and divide that by our sales to capital ratio of 0.75.
Reinvestment = $3,848.76 / 0.75 = $5,131.68
Next, we would reinvest capital and reduce our free cash flow to the firm to find an actual free cash flow to discount back to the present value.
As you work through the succeeding years of your DCF, you will continue to reinvest capital to grow the company’s revenues. A way to check if this is realistic is to add up the total amount reinvested over the DCF and recalculate your ROIC at year ten and see if that number is logical.
We can adjust our projections as we advance with any number if we are logical and stick to realistic numbers, remembering that Verizon is not likely to grow revenues at 22%, with an ROIC of 38% in year 10.
For example, revenues can change over time, as can operating margins, tax rates, and invested capital. We have a company operating with a tax margin of 22%, and the new administration takes power. They tell the whole world they will raise corporate tax rates; it would be unrealistic to assume your company will maintain the same tax rate in the next ten years; therefore, you need to account for those changes.
But for our purposes today, let’s look at some real companies and see how this process goes with the impact of reinvested capital on our cash flows and valuations.
Practical Examples of the Sales to Capital Ratio
The first company I would like to look at is Verizon; since we have spent much of the post discussing the company, let’s see its impact on capital ratio. I am using the free downloadable spreadsheet from Damodaran.com as my template.
All the numbers come from Verizon’s latest 10-k, 2020, and all assumptions are based on my analysis and company projections.
Below is a chart outlining the value and impact of the cash flows with a capital ratio of 0.75, with the revenue growth stated at 3%, per Verizon’s latest guidance.
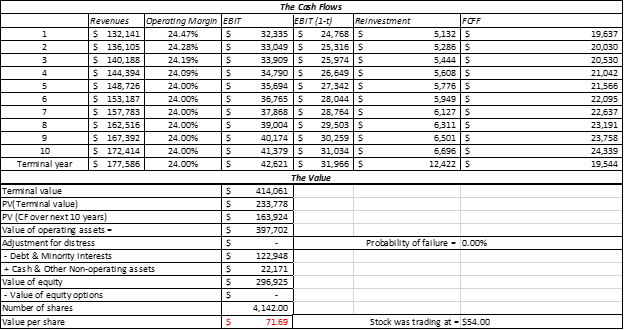
Now, to see what would happen if we removed the impact of reinvestment from the cash flows, we see the following value

Which gives us a valuation of $118.17 per share for Verizon, which is quite a bit higher than the current market price of $54. Now, think about how reasonable that number is because only growing revenues at 3% is not likely.
What would the value be, everything remaining constant, and we up the sales to capital ratio of 1.5?
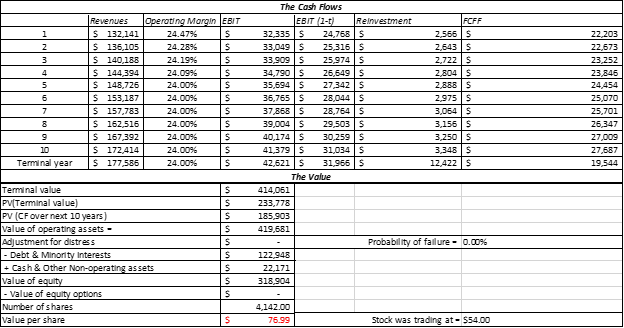
We can see a higher value of $76.99, which tells us the more efficiently Verizon uses its invested capital, the more it will grow its fair value.
With Amazon, let’s try one more to see the impact on free cash flows from its high sales to capital ratio.
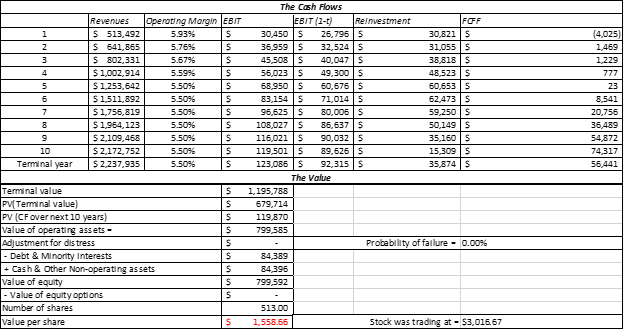
We can see that the company has a value of $1,558.66 per share based on the following assumptions:
- Revenue growths 33% for the first year and 25% over the balance of the DCF
- Operating margins of 5.93%, moving to 5.50%
- Tax rates rising to 25%
- Sales to capital ratio of 4.13
If we lower the sales to capital ratio to the industry average of 1.80, everything else being the same, the per-share value drops to $725. That shows the impact reinvestment has on the value of the cash flows of Amazon. For Amazon, it is critical to the business’s growth to reinvest in the business, especially with lower operating margins.
Investor Takeaway
One of the more important aspects of investing is the price we pay matters; if we ignore the price, we will not make as much we could with another investment.
Using intrinsic value models such as a discounted cash flow model is one of the best methods to calculate a company’s fair value. They are not perfect, by any stretch, because of the model’s nature; we assume future growth rates of revenues, operating margins, cost of equity, and terminal values.
When putting together or using any valuation model, our best bet to build in a margin of safety is to try to be as realistic or conservative as possible, giving us a cushion if our assumptions are incorrect.
One way to help adjust cash flows is to account for the impact of reinvestments in the business. We have to think about the nature of assets and liabilities, plus equity in the business. That nature drives growth in the business; inventories, for example, provide items for sale for Walmart, which helps drive sales. Those assets are bought and sold with the cash from operations of the business, which comes from Walmart’s operating marigns. If the company uses debt to purchase more inventories(assets), that cash comes from the company’s invested capital.
Because of the nature of how companies use their invested capital, we need to account for that impact on the company’s cash flows and the efficiency of those reinvestments.
Think back to the value of Amazon; if the company was far less efficient in investing, then the value of the company drops. Where Verizon doesn’t need to reinvest as much because they are a more mature company, but Verizon is far more efficient than AT&T, which helps drive more value for Verizon.
I would encourage you to consider adding a line item to your DCF models to account for that reinvestment and use the sales to capital ratio to measure the efficiency of that reinvestment.
With that we will wrap up our discussion today on the sales to capital ratio.
As always, thank you for taking the time to read today’s post. And I hope you find something of value in your investing journey. If I can be of any further assistance, please don’t hesitate to reach out.
Until next time, take care and be safe out there,
Dave

Dave Ahern
Dave, a self-taught investor, empowers investors to start investing by demystifying the stock market.
