Updated 2/7/2024
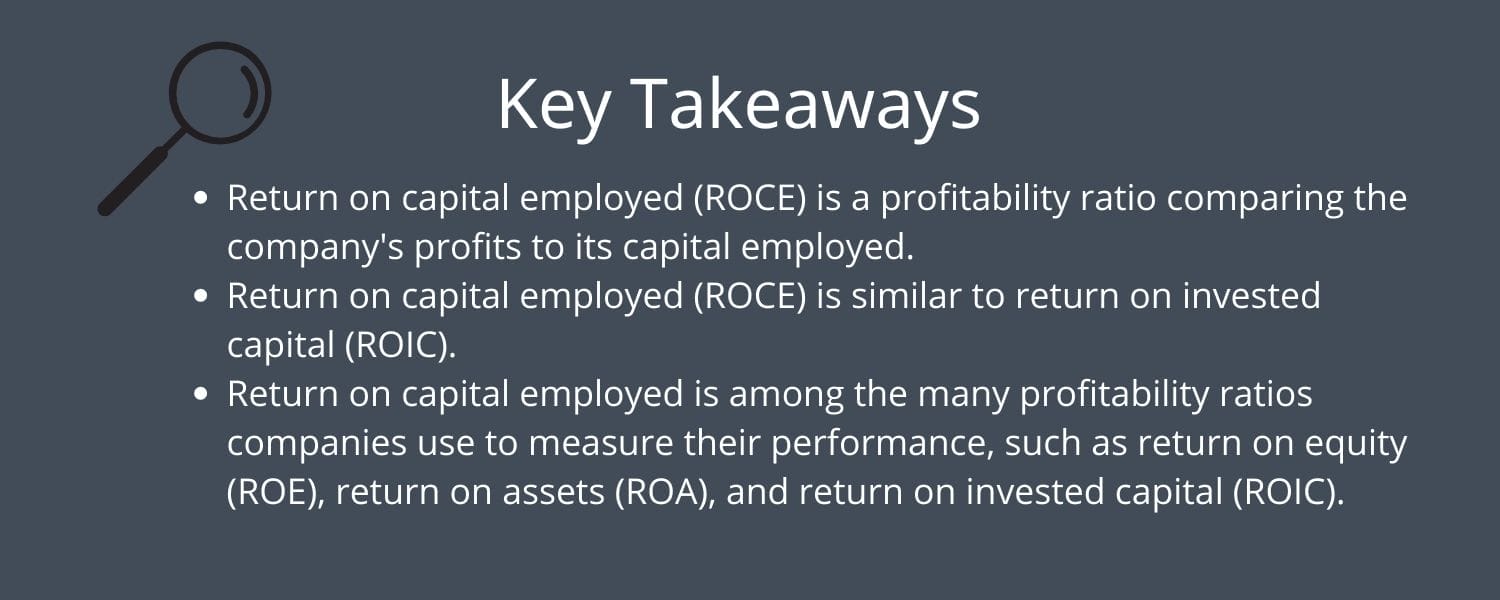
One of Terry Smith’s investing foundations’ main pillars is investing in good companies, which he defines as companies with high returns on capital employed. For those unfamiliar with Smith, he runs Fundsmith, whose returns have almost doubled those of the S&P 500 over the last decade.
Smith’s Fundsmith has investments that have averaged over 29% since 2010. Return on capital employed, also known as ROCE, is similar to return on invested capital. It helps investors determine how effectively a company uses its assets to drive revenues and profits.
The better or more efficiently a company reinvests its assets, the better the returns will be over a long period. Charlie Munger on return on capital:
“Over the long term, it’s hard for a stock to earn a much better return than the business underlies it. If the business earns 6% on capital over 40 years and you hold it for that 40 years, you’re not going to make much difference than a 6% return—even if you originally bought it at a huge discount. Conversely, if a business earns 18% on capital over 20 or 30 years, even if you pay an expensive-looking price, you’ll end up with a fine result.”
In today’s post, we will learn:
- What is the Return on Capital Employed?
- How Do I Calculate Capital Employed?
- What Does the Return on Capital Employed Indicate?
- What is a Good Return on Capital Employed?
Okay, let’s dive in and learn more about the return on capital employed.
What is the Return on Capital Employed?
Return on capital employed, per Investopedia, means:
“Return on capital employed (ROCE) is a financial ratio used to assess a company’s profitability and capital efficiency.”
The easiest way to think about the return on capital employed is to tell us how efficiently a business deploys its capital. Or how well the company generates profits from its equity. Remember, the company’s equity combines the shareholders’ equity and long-term liabilities, i.e., debt.
Both shareholders’ equity and debt help a company purchase assets it can use to drive profits. For example, Amazon’s retail segment carries an inventory of millions of items, and it may purchase inventory from either equity or debt in the company. The company then uses the same inventory to drive more revenue.
In Amazon’s case, because the company is profitable, those revenues flow to net income, which becomes retained earnings, part of shareholder equity, for the company, which allows them to buy more inventory.
Return on capital employed (ROCE) is a profitability ratio that tells us how efficiently companies turn their capital into operating profits. ROCE is very similar to return on invested capital (ROIC), and many companies use those two ratios, plus return on equity (ROE) and return on assets (ROA), to measure their performances.
Before digging into the return on capital employed, refer to the below links to learn more about the ratios mentioned earlier:
Before digging into the ratio calculation, let’s look at a flow chart to illustrate this concept.
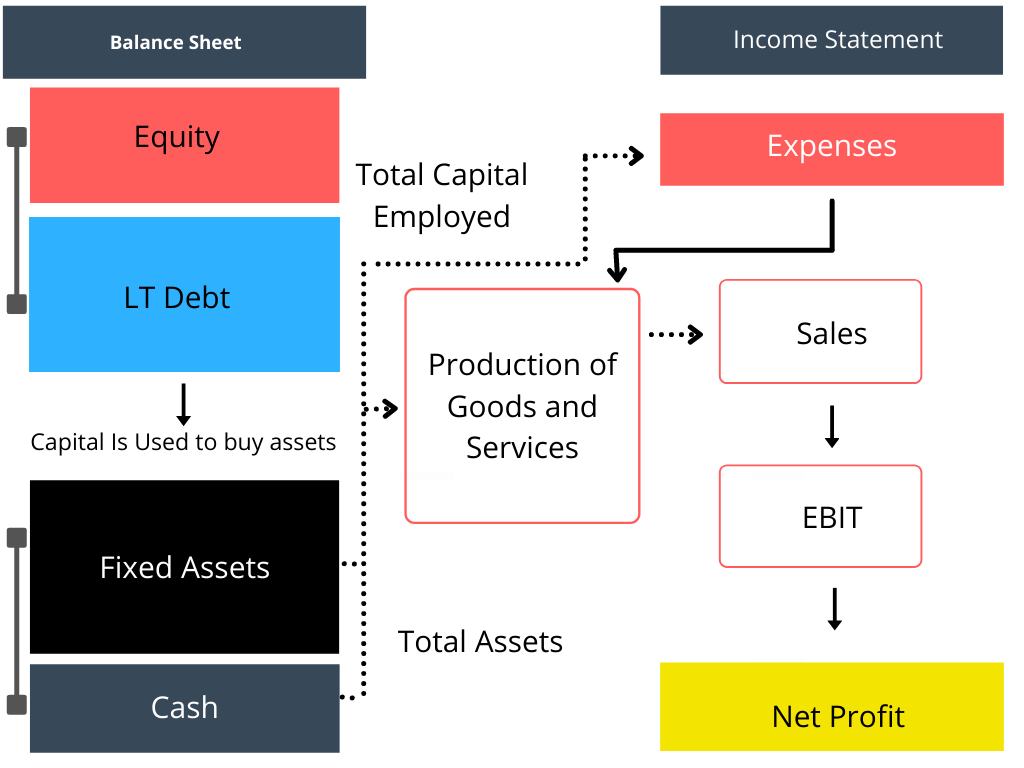
From the above illustration, we can see how equity and debt purchase fixed assets and cash, which flows to producing goods and services, and sales drive expenses and operating income.
And with our return on capital employed ratio, we can measure how effective that flow is for the business.
How Do I Calculate the Return On Capital Employed?
The most traditional way to calculate the return on capital employed is:
ROCE = EBIT / Capital Employed
Where:
- EBIT equals earnings before interest and taxes or operating income.
- Capital Employed equals total assets minus current liabilities
EBIT, or operating income, tells us how much profit a company makes after subtracting the cost of goods sold and operating expenses such as payroll, R&D, and SG&A from revenues. EBIT excludes the impacts of taxes and any interest expenses or income, so it solely stems from operations.

Like invested capital from the ROIC ratio, capital employed subtracts total assets from current liabilities. That subtraction gives us shareholders’ equity and long-term debt, which the company uses to drive revenues and profits from the above example.
Some analysts use an average of capital employed, which means they calculate it for a period measured between two periods.
We can also replace net operating profit with EBIT or use NOPAT from ROIC. The main issue is remaining consistent with your usage.
ROCE Example: INTU
Okay, let’s calculate the ROCE to see how this works. I want to use Intuit (INTU) for our guinea pig. We will use the latest 10-k. I will pull the information from the financial statements to calculate our ratio.
I included a simple ROCE calculator to help you with the calculations; input the date from the financials below, and the calculator will do the rest.
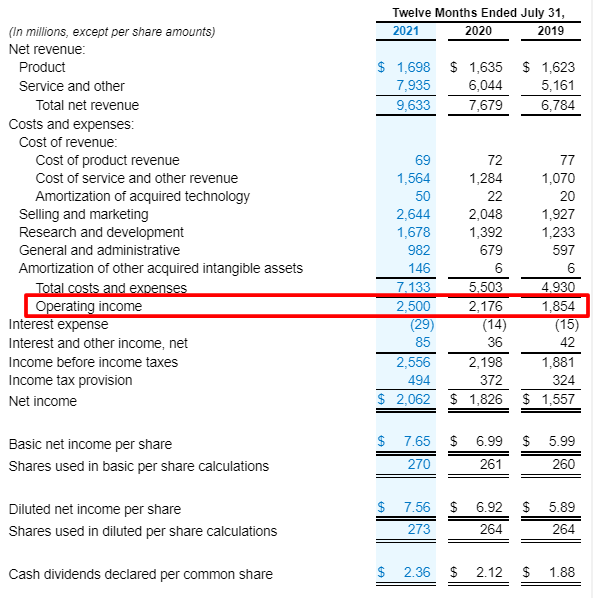
EBIT for Intuit in 2021 and 2020 equals:
- 2021 – $2,500 million
- 2020 – $2,176 million
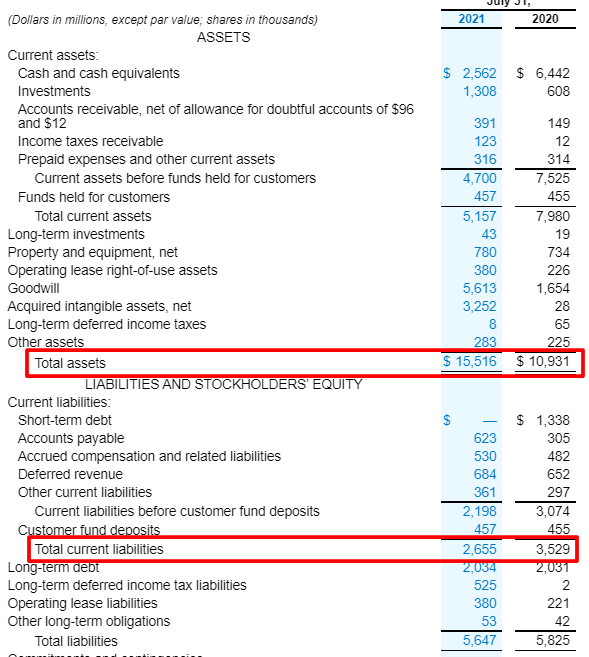
Total assets and current liabilities for Intuit:
- 2021 Total Assets = $15,516 million
- 2020 Total Assets = $10,931 million
- 2021 Current Liabilities = $2,655 million
- 2020 Current Liabilities = $3,529 million
Now, we can plug all the info into our ratio to determine how efficiently Intuit uses its capital.
|
Item |
2021 |
2020 |
|
EBIT / |
2,500 |
2,716 |
|
Total Assets |
15,516 |
10,931 |
|
2,655 |
3,529 |
|
ROSE |
19.43% |
36.69% |
That was pretty simple, huh?
INTU ROCE Compared to Peers
To give it further context, comparing the return on capital employed to others in the company’s industry remains the best practice.
To compare Intuit, let’s look at some of its peers, using TTM numbers as of July 20, 2022, all numbers in millions unless otherwise stated:
- Zoom Video (ZM)
- SAP
- Autodesk (ADSK)
- Workday (WDAY)
|
INTU |
ZM |
SAP |
ADSK |
WDAY | |
|
EBIT |
$3,142 |
$1,019 |
$5,860 |
$816 |
$-151 |
|
Total Assets |
$28,514 |
$7,956 |
$84,493 |
$8,261 |
$12,799 |
|
Current Liabilities |
$3,591 |
$1,809 |
$23,262 |
$3,801 |
$4,781 |
|
ROCE |
12.61% |
16.58% |
9.57% |
18.30% |
-1.88% |
As the chart earlier shows, Intuit remains the third-highest performer in its peer group, while Workday remains the lowest.
Another great example of using ROCE looks at it over a longer period, so for Intuit, I will put together the numbers over the last ten years to get an idea of how the company does.
|
Year |
ROCE |
|
TTM |
12.61% |
|
2020 |
19.68% |
|
2019 |
29.78% |
|
2018 |
42.95% |
|
2017 |
46.00% |
|
2016 |
66.76% |
|
2015 |
62.13% |
|
2014 |
27.48% |
|
2013 |
34.39% |
|
2012 |
28.72% |
Digging deeper, we see that the average for Intuit over the ten years recorded:
Average = 37.05%
Median = 32.09%
All of this tells how the company did in the last twelve months compared to its historical average and median, and we can easily see the impact Covid might have had on Intuit. Of course, this is the point without digging deeper into the company’s financials, giving us a question we need to answer before investing in Intuit.
Just for giggles, let’s compare Intuit’s NOPAT to EBIT to see how much impact the return on capital employed has.
- TTM EBIT = $3,142 million
- TTM Tax rate = 17.83%
- NOPAT = 3,142 * (1 – 17.83%) = $2,582
- Total Assets = $28,514
- Current liabilities = $3,591
- ROCE = 10.36%
When comparing the operating income ROCE of 12.61%, we see the impact taxes have on Intuit’s operating income.
If you want a more conservative number, using NOPAT will give you a lower ROCE and might be a good comparison to ROIC, which for Intuit was 12.61% for the TTM.
What Does Return on Capital Employed Indicate?
The return on capital employed tells us how much operating income, or NOPAT, Intuit creates for each dollar of capital employed.
For example, the company’s latest TTM numbers indicate Intuit generates 12 cents of operating income for every dollar of capital employed. Over the last ten years, the company has produced 36 cents of operating income for every dollar of capital employed.

If we look at the other profitability ratios of Intuit over the same period:
- ROE = 18.66%
- ROA = 8.9%
- ROIC = 12.6%
- ROCE = 12.61%
All the above numbers, except ROCE, are from Finchat.io
Those numbers tell us Intuit remains a profitable company across all metrics. The most important relationship is comparing ROCE to the WACC (weighted average cost of capital), which tells us how much capital we measure costs the company.
If the company continues creating value, all the above profitability metrics will be higher than its cost of capital; if profitability remains below the cost of capital, the lower profitability indicates the company continues destroying value with its capital.
As we discovered by calculating the ROCE ratio, we determine how efficiently Intuit uses its capital to grow its operating income. If the cost of that capital exceeds the ROCE, it is too expensive for the company to expand because that cost remains higher than its returns, making those expansions unprofitable.
What is a Good Return on Capital Employed?
The answer depends on the company and industry in which the company operates. For example, comparing the ROCE for Exxon to Apple remains a poor idea. Apple exemplifies a capital-light company, whereas Exxon exemplifies a capital-heavy company, and the method they use to grow operating profits remains different.
Instead of using a blanket rate such as 20%, we should look at your company’s ROCE over a longer period, such as five to ten years, and compare them to others in the same industry. For example, compare Exxon to BP, Chevron, and BP and see how your company stacks up compared to its peers.
In the example earlier with Intuit and its peers, Intuit remained slightly below Autodesk but ahead of Workday by quite a bit. Then, we see Intuit performs well compared to its peers while Workday continues to underperform. When analyzing Workday, it might be worth looking at the companies’ performance over a longer period to see if the year was an anomaly or a sign of something bigger.
Generally, we want a higher number because a higher number indicates more profitability.
For example, we looked at Intuit throughout the post, but Albemarle, the lithium miner, has an ROCE of 7.31%, lower than the company’s WACC of 11.45%. We keep in mind that Albemarle operates as a far more capital-intensive business than Intuit, and it’s subject to commodity prices, which causes fluctuations in revenues.
With the proliferation of tech stocks and capital-light industries in today’s markets, the ROCE ratios will be higher than those in more capital-intensive industries.
When deciding if your company is profitable, it is best to consider what industry the company operates in and compare its performance to others in its peer group. But in general, the higher, the better.
Some industries will naturally have higher returns on capital employed, but a good rule of thumb is to look for two things:
- A return higher than 10%
- A return higher than twice the 30-year Treasury rate, which is 3.16% as of 7/20/22, giving us a rate of 6.32%
The formula for ROCE is simple and doesn’t take long to calculate. I mention this because, except for gurufocus.com, no financial website I have found lists ROCE as a metric we can use as a screen. When analyzing any company, ROCE remains a great ratio to add to your toolkit.
Frequently Asked Questions About Return on Capital Employed
Why is ROCE useful if we already have metrics like ROA and ROE?
Some analysts and investors prefer the return on capital employed over others because ROCE considers debt and equity financing. Many investors believe ROCE gives a better insight into how the company grows and reinvests over time than ROA or ROE.
What is the difference between ROIC and ROCE?
Both ratios use similar methods to determine a company’s profitability, comparing the capital to the operating income or NOPAT.
In general, we want to see ROIC and ROCE higher than the company’s cost of capital. These gaps indicate a company is growing through its reinvestments; a closing gap or ratio lower than the capital cost indicates a company is destroying value.
ROIC calculations include more complicated measures of invested capital. You have two choices:
- Net working capital plus property, plant and equipment, and goodwill/intangibles.
- Or you can use debt plus shareholders’ equity less cash and equivalents.
ROCE uses total assets and current liabilities to determine the invested capital easily.
ROIC gives a more detailed, complete look, but not so much more than ROCE, and given the ease of calculations, it remains a far better back-of-the-envelope choice.
What does it mean for capital to be employed?
Intuit uses its capital every day to operate the business. For example, the company uses capital to buy inventory, pay salaries, reinvest in R&D, pay down debt, etc.
The higher the ratio, the more efficiently the company employs its capital.
For example, we would rather invest in Intuit or Autodesk than Workday based on the higher ROCE. The higher ROCE tells us Autodesk uses capital more efficiently and has better growth prospects.
Investor Takeaway
Returning to Terry Smith, with whom we started the post, his current portfolio sports ROCE ratios of 28% at the end of 2021. That is a great place to start to analyze your portfolio and the companies you are eying up. Keep in mind the breakdown of his portfolio is:
- Tech = 28.9%
- Consumer Stables = 27%
- Healthcare = 22.6%
- Consumer Discretionary = 10.1%
- Communication Services = 4.5%
- Industrials = 3.4%
- Cash = 3.5%
The tech sector’s interesting aspect is the largest, but if you add up the next three, they outweigh the tech sector, and none of those would be classified as “growth” by most investors. I am trying to ensure you don’t have to buy only tech to experience growth, and using ROCE can help you find profitable companies in any sector.
Return on capital employed, like return on equity and return on assets, is simple to calculate, but it offers a different way to analyze your companies. It allows you to see how well a company uses its capital to create profits because it flows to operating income. It is great to see how profitable your company is from its operations.
Another reason the return on capital employed is a great ratio is that it encompasses its debt, whereas the return on equity does not. Depending on the company, debt helps amplify the returns a company earns because debt can help fund those projects or products that help the company grow revenue, which flows to the operating income.
The more efficiently the company employs its capital, the greater revenue growth. And if the company operates on all cylinders, that revenue growth will grow its operating income and net income. All those factors lead to share appreciation as Wall Street sees the company is growing revenues and earnings, which helps the price grow.
With that, we will wrap up our discussion for today. As always, thank you for taking the time to read today’s post. I hope you find something of value in your investing journey. If I can further assist, please don’t hesitate to reach out.
Until next time, take care and be safe out there,
Dave

Dave Ahern
Dave, a self-taught investor, empowers investors to start investing by demystifying the stock market.
